Linking Flood and Drought Data to Water Safety Planning: Part 3
Analysing the datasets
In Part 2 of this blog series, I provided the criteria used to select datasets for analysis and incorporating into the Water Safety Planning. One of the difficulties experienced by water utilities when using the Flood and Drought Portal is how to incorporate the datasets into their respective water safety plans. Our team is developing a guidance document to assist water utilities to incorporate climate related data into their WSP. The team aims to answer the following questions from utilities in a sequential manner through the guidance document:
1. Where can I access climate related data?
Climate related datasets can be accessed from various sources including National Oceanic and Atmospheric Administration (NOAA), NASA, Climatic Research Unit (CRU), WorldClim but to name a few. Data on the Flood and Drought Portal can be accessed in the Data and Information Application (Figure 1) using the following URL http://www.flooddroughtmonitor.com. In order to access and use the data within the Portal the user will have to setup an account for their own water utility. However, to get a general idea of the portal and the different applications the user can select ‘Demo’. The ‘Demo’ option provides the user with limited access to the applications within the Portal, therefore users are encouraged to register for full access to the applications.
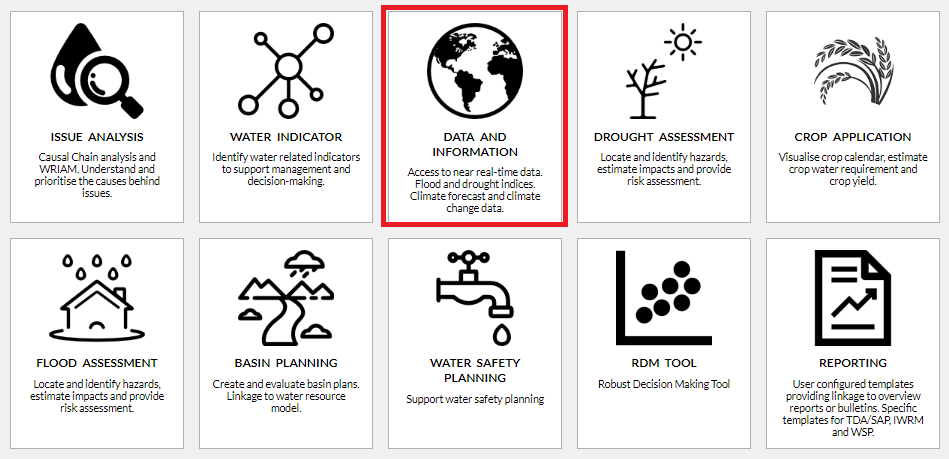
Figure 1: View of the applications within the Flood and Drought Portal. The data and information application highlighted in red is where all the datasets available within Portal can be found.
2. There’s too much data/information, which datasets do I select?
There are more than 26 datasets available within the Portal. The guidance document presents a list of datasets that have been selected for users to analyse, and incorporate into their WSP. The selected datasets can be used for short-term analysis and long-term analysis, and require no specialised skills or software. Furthermore, these datasets allow the user to determine if conditions are ‘wetter’ or ‘drier’ (For more information on the selected datasets see Linking Flood and Drought Data to Water Safety Planning: Part 2).
3. How do I use and interpret this data?
The portal allows users to access and view the datasets in different formats. These include graphs, tables and GIS maps. These can be viewed within the portal or may be downloaded so the user can process the data using their own tools and methods. The guidance document provides water utilities with a methodology to download and analyse selected datasets so that they may incorporate the datasets into their respective WSP.
The obvious effects floods and droughts have on water utilities are that floods bring wetter conditions and droughts drier conditions. A methodology was used to determine if conditions are wetter or drier using the selected datasets. For rainfall data the ‘percent of normal’ was calculated, and for temperature data ‘deviations’ from the mean were calculated.
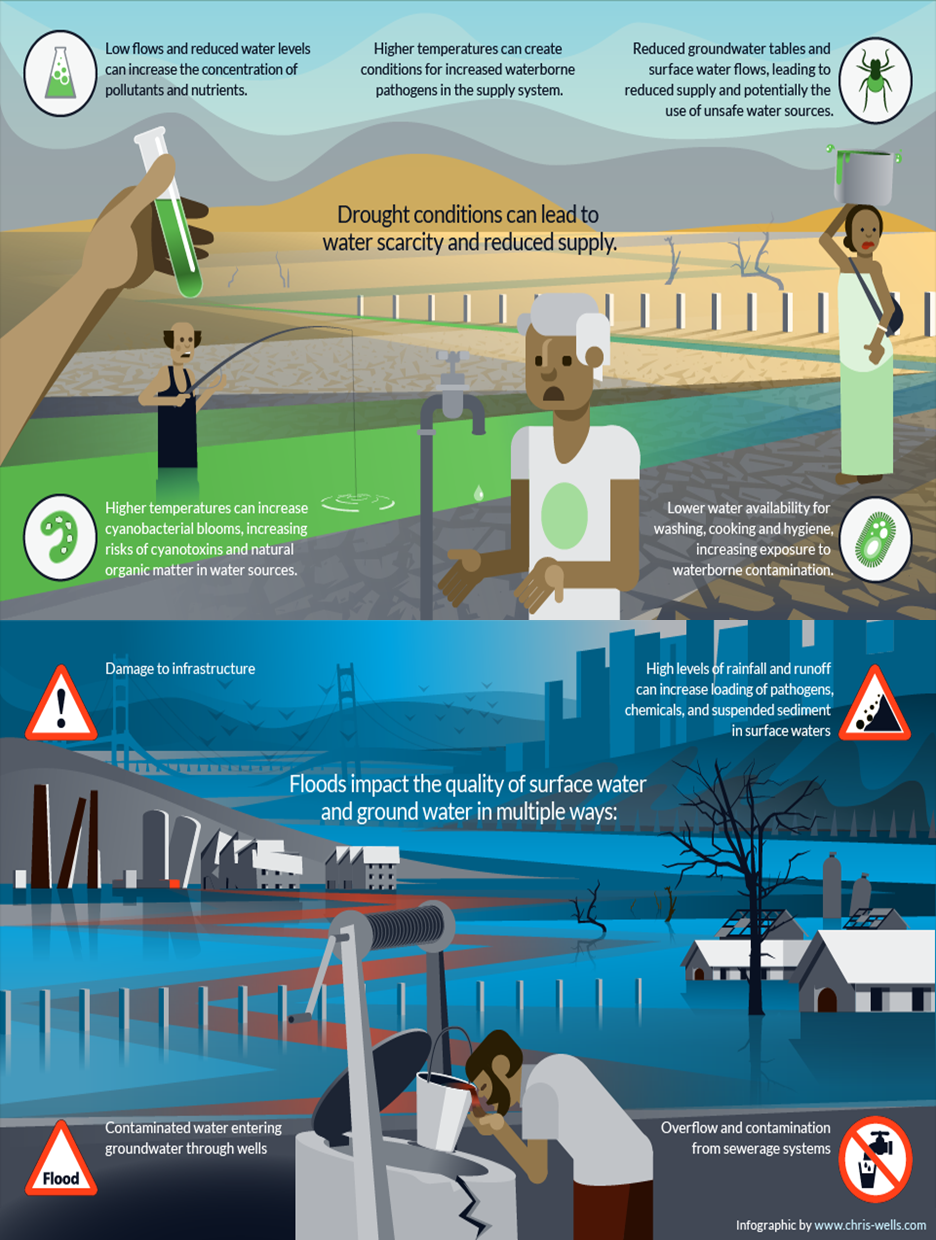
Figure 2: Impacts during wet and dry periods (image source: www.chris-wells.com)
For rainfall, if the ‘percent of normal’ was more than 100%, then the physical conditions were wetter than normal. If ‘percent of normal’ indicated conditions that were less than 100% then the physical conditions were drier than normal. There are four physical conditions that describe ‘wet’ conditions, and four physical conditions that describe ‘dry’ conditions (Table 1). The physical conditions were used to describe the rainfall severity.
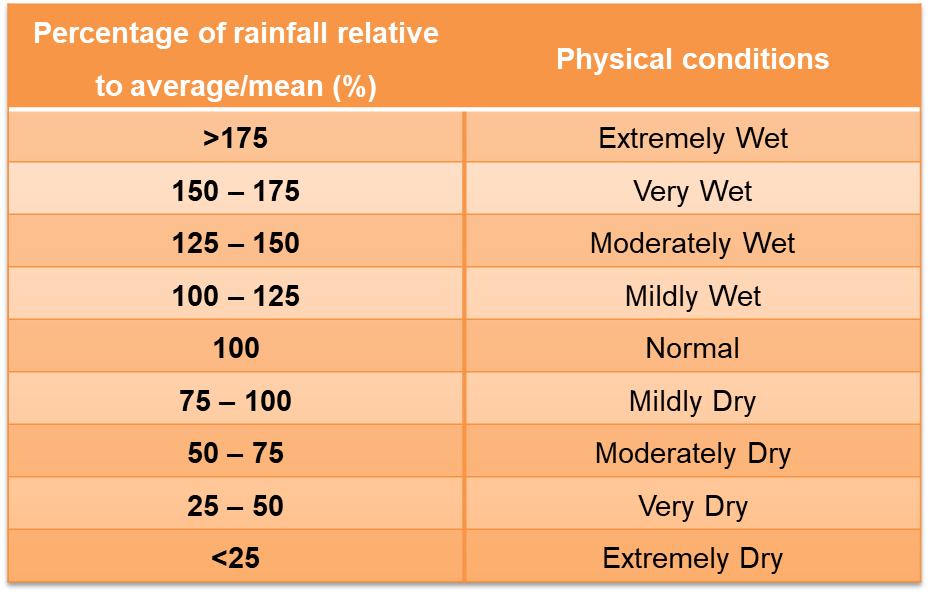
Table 1: Percent of normal ranges and their corresponding physical conditions
For temperature, if the deviations indicated values that were more than 0°C, then the physical conditions indicated an increase in temperature. If temperature deviations indicated values that were less than 0, then the physical conditions indicated a decrease in temperature. There are four physical conditions that describe increased temperature conditions and four physical conditions that describe decreased temperature conditions (Table 2). The physical conditions were used to describe the temperature severity.

Table 2: Temperature deviations and their corresponding physical conditions
The likelihood was determined by counting the number of months rainfall and temperature was higher than normal, and the number of months rainfall and temperature was lower than normal. In the case of likelihood, some years may experience more months that indicate increases in rainfall and temperature and other years may experience more months that indicate decreases in rainfall and temperature. The example for rainfall presented in Figure 3, indicates 5 out of 12 months had an increase in rainfall relative to the mean, and 7 out of 12 months had a decrease in rainfall relative to the mean.
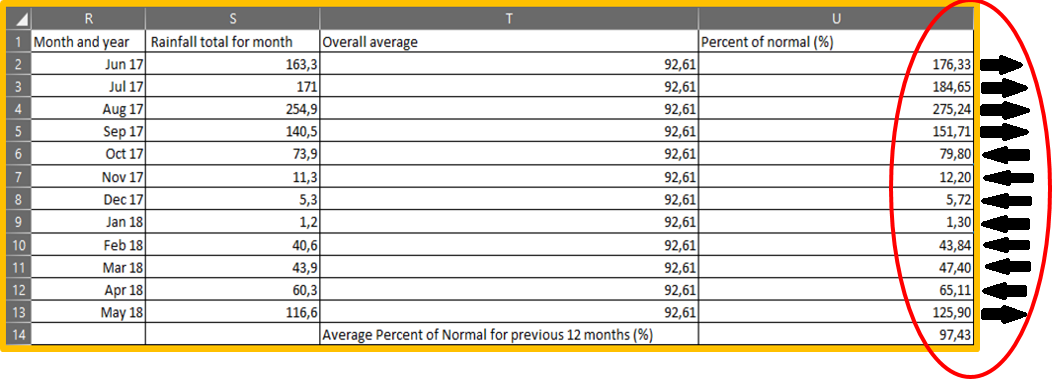
Figure 3: Table with calculated percent of for each month, overall percent of normal.
In Blog 4, I will discuss how to amend the risks for hazards and hazardous events using the conclusions of wet or dry rainfall conditions, increased or decreased temperature conditions, and likelihood. The aim is to show how the risks of a hazard will change under the influence of climate change (Figure 4).

Figure 4: Amended risk matrix for a particular risk. The risk matrix indicates that the risk score increased from 6 to 9
Drought in Cape Town
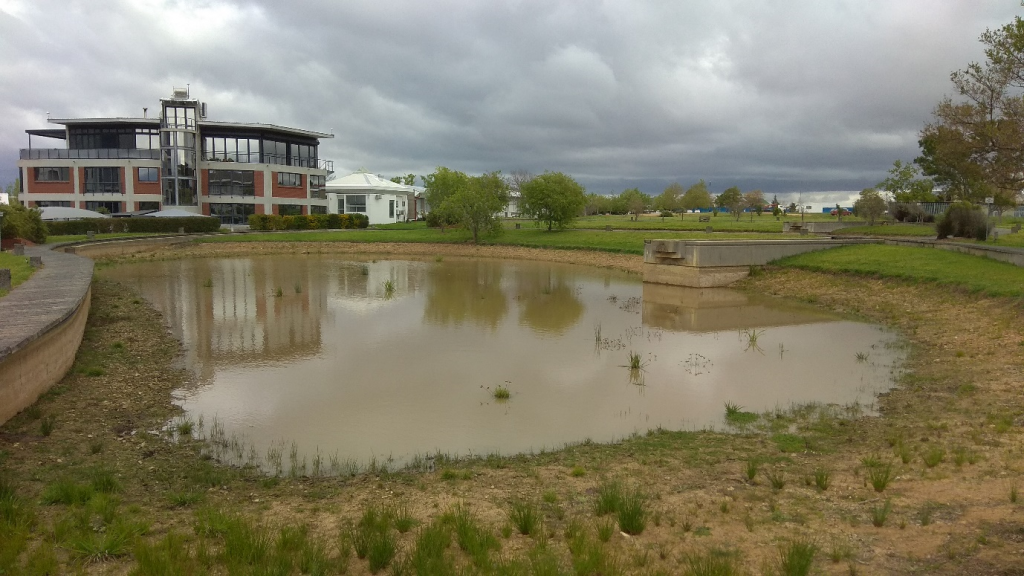
The drought in the City of Cape Town located in the Western Cape, South Africa is well-publicised in news around the world. The drought has shown significant relief, and dams supplying the city with water are currently 74.3% full. Even though this figure is not ideal, it is significantly better than last year where it was only at 37.5% in the same week. The below figure 5 show stormwater detention ponds in a business park Stellenbosch have responded to the 2018 rains so far.
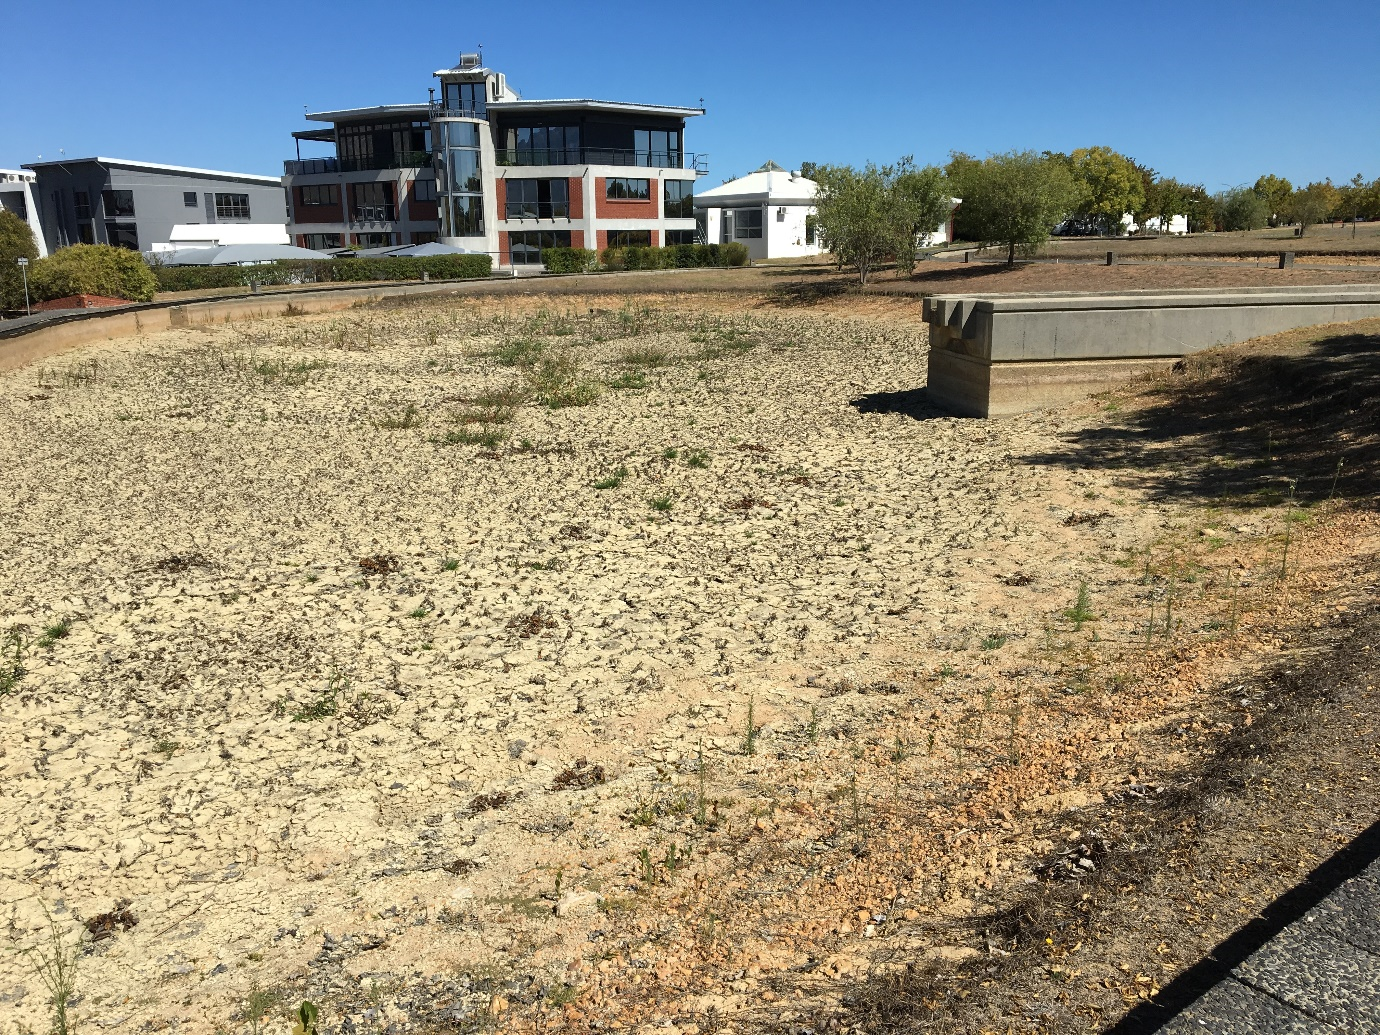
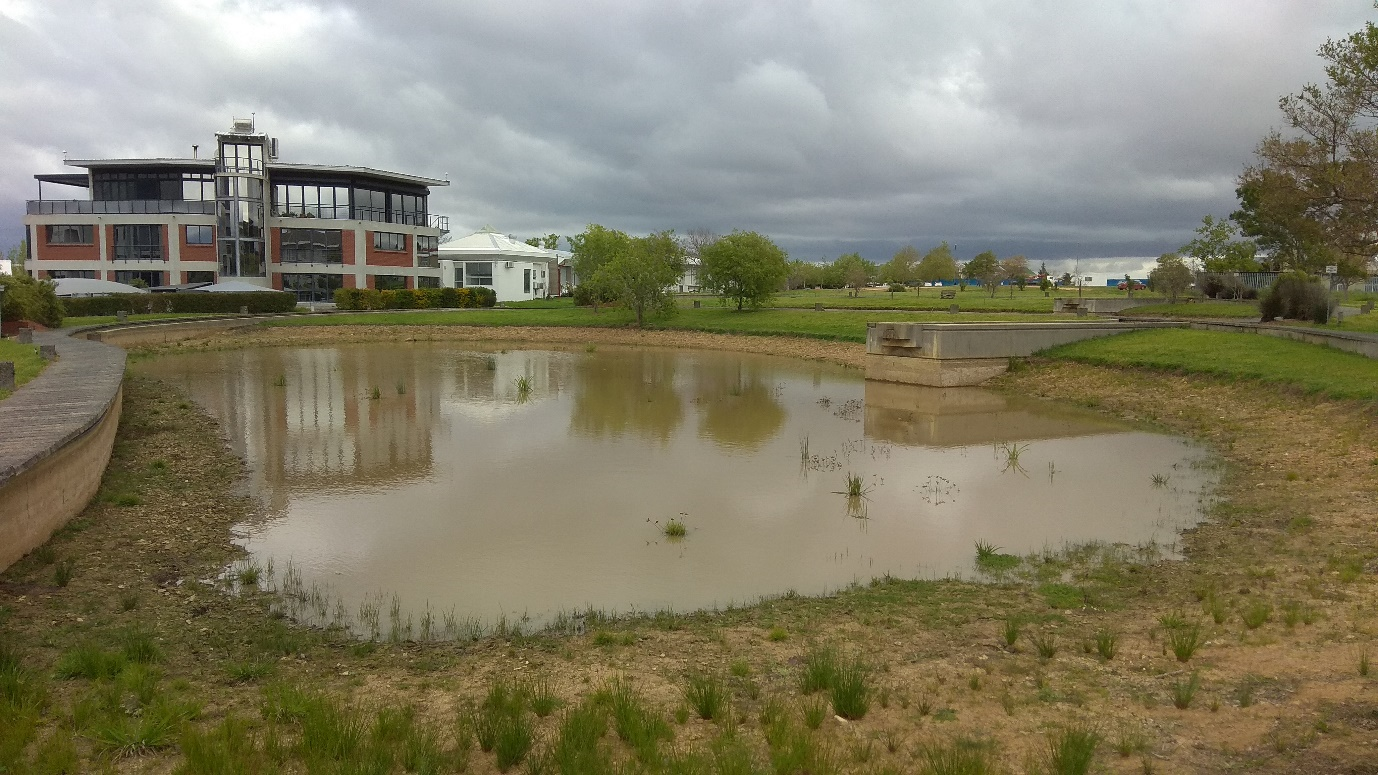
Figure 5: Stormwater detention ponds in a small business in Stellenbosch. Before the rainy season these ponds were barren, nut as the rainy season has progressed have gradually filled up.
About the Flood and Drought Management Tools project
The Flood and Drought Management Tools (FDMT) project funded by the Global Environment Facility (GEF) International Waters (IW) and implemented by UN Environment (UNEP), with DHI and the International Water Association (IWA) as the executing agencies. The project is developing online technical applications to support planning from the transboundary basin to water utility level by including better information on floods and droughts. The project is being implemented from 2014 – 2018, with 3 pilot basins (Volta, Lake Victoria and Chao Phraya) participating in development and testing of the methodology and technical applications.
For more information on the Flood and Drought Management Tools project, visit: http://fdmt.iwlearn.org.
_________
A series of webinars on the theme of Climate Smart Utilities will be held over the next few months including:
- “Interpreting climate information for water utilities” on 25 October 2018
- “Climate resilient water safety planning” on 28 November 2018.
- Vision to action, how to build climate resilient water utilities – date to be determined