About International Statistics for Water Services
This report is now in its fifteenth edition, and this update contains data from 34 countries and more than 180 cities worldwide. This report enables high-level comparisons concerning abstraction, consumption, tariff structure and regulation of water services globally.

These data provide a starting point for debate on how services can be or should be financed, the importance of water tariff structures, and topics like consumption patterns, taxes, leakages, etc. In general, this information can help organizations set up strategies from a holistic management perspective.
Water under pressure
Water price structure and water pricing are not stand-alone mechanisms to ensure sustainable water use. In fact, sustainability can only be obtained by change of the customer behaviour directly linked to the awareness of scarcity of the water resources all over the world.
The one and best solution to an ideal water tariff structure does not exist. But we can state that water companies, par definition, are so called “fixed cost” companies. As a consequence, the fixed cost should play a major role in the discussion about water billing. Of course, we have also to take into account that the water bill should reflect the variable costs of a water company, “total cost recovery” being the ultimate goal.
The water footprint: a huge concern?
The consumption of potable water is widely variable, with a large gap between cities in our research. Household consumption per capita varies from 65 liters per capita per day in Korce, Albania, to 434 liters per capita per day in Vancouver, Canada: a factor of 7.
Water abstraction per country is also widely spread, ranging from 59 m3 per capita per year in Slovakia to 542 m3 per capita per year in Russia.
A very important factor in the discussion of affordability of the water bill is the global fiscal pressure in a country. Although taxes (like VAT) are an important part of the water bill, there is no standardization. There is a wide range from 0% to 27% for the VAT in the mentioned countries. Also a significant trend in a number of countries is a divergence of the VAT charged on water and wastewater – a low VAT for potable water and a higher VAT for wastewater collection and treatment. This stems from the desire to keep water bills affordable, as potable water is a human right.
In one-third of the cities surveyed, the environmental charges (= total sewerage and wastewater treatment charges) exceed 50% of the total water bill. This percentage is still rising. This helps to explain the remarkably high spread of the total water bill for 200 m³ across the 173 cities, from 24 US$ in Mumbai, India, to almost 2 372 US$ in Moscow, Russia.
The upcoming trend of higher VAT on wastewater in more countries reflects the fact that on one hand, the total cost of wastewater is also really much higher than the total cost of potable water stricto sensu, and on the other hand, the higher VAT being used as an incentive to reduce the environmental footprint of wastewater. But if this is really the purpose, it should be clearly communicated to the customer. The affordability and the ability to pay for the total water bill always need to be considered in this framework.
Whereas VAT is a fiscal tool of the government, water companies also have a major mission to help consumers to reduce their wastewater footprint, by promoting the circular use of water and wastewater. Conserving and protecting the scarce water resources we have today is critical to preserve them for future generations. We all must work together to respond to the challenges associated with climate change.
Rising costs and keeping water affordable
Around the world, water companies and authorities continue to face challenges in the delivery of water and sanitation services. Rapid urbanisation, ageing infrastructure, water scarcity, poor water quality and network losses all require new investments, which often results in increased costs. Water’s role in public health has also been in the public eye due to the recent COVID pandemic, and many water providers may have delayed tariff increases and shutoffs due to the financial burden on customers and concern for public health.
Overall, the cost of water and sanitation services remains low when compared to average household incomes in the most upper-middle- and high-income countries. Concerns remain on the affordability for the poorest segments of the population. In 2021, 151 cities submitted tariff data to the IWA database (24 in the East Asia & Pacific, 13 in North America, 96 in Europe & Central Asia, and 18 in Latin America & Caribbean).
The latest data shows that tariffs have generally increased between 2019 and 2021. As measured in local currency, the median increase in total water and sanitation fees between 2019 and 2021 for 200 m³ was 3.4%. This matches the same median increase as between 2017 and 2019. The median increase in water fees for 200 m³ was 2.6%, suggesting that the increase in sanitation and related environmental fees outpaced the increase in fees for potable water.
When compared to inflation, tariff increases for 200 m³ of water and sanitation exceeded inflation in 45% (64 of 143) of cities. The tariff increases for 200 m³ of water and sanitation exceeded the increases to the minimum wage in 47% (67 of 143) of cities. This may indicate that overall, tariffs are uniformly increasing with minimum wage and inflation. The average cost in 2021 for 200 m³ of water and sanitation for cities in the database was 623 US$, with a median of 490 US$. In US$, for high-income countries, the North American region had the highest tariffs, followed by Europe & Central Asia, Latin America & Caribbean, and then East Asia & Pacific.
For cities in the database, to afford a bill for 200 m3 of both water and sanitation, the median number of minimum wage hours was 88 hours. For 100 m3, the median was 49 hours. The number of hours is slightly higher in middle-income countries than in high-income countries and there is a large variation between cities: for total water and sanitation fees for 200 m³ one may need to work between 23.0 (Taipei, Taiwan) and 244.2 (Coyhaique, Chile) hours. By region, the most work hours are needed in Latin America & Caribbean and are subsequently followed by Europe & Central Asia, North America, and then East Asia & Pacific.
One should take note that cities with a high number of hours could have low minimum wages and have other ways to make water and sanitation fees affordable for low-income families, such as subsidies or social rates that are not reflected in the standard tariffs. Tariffs and affordability are hotly debated and the IWA statistics database can contribute to getting comparable insights across a large number of cities.

Figure 1. The hours of work at minimum wage required to afford 200 m³ of water and sanitation fees for cities in the database.
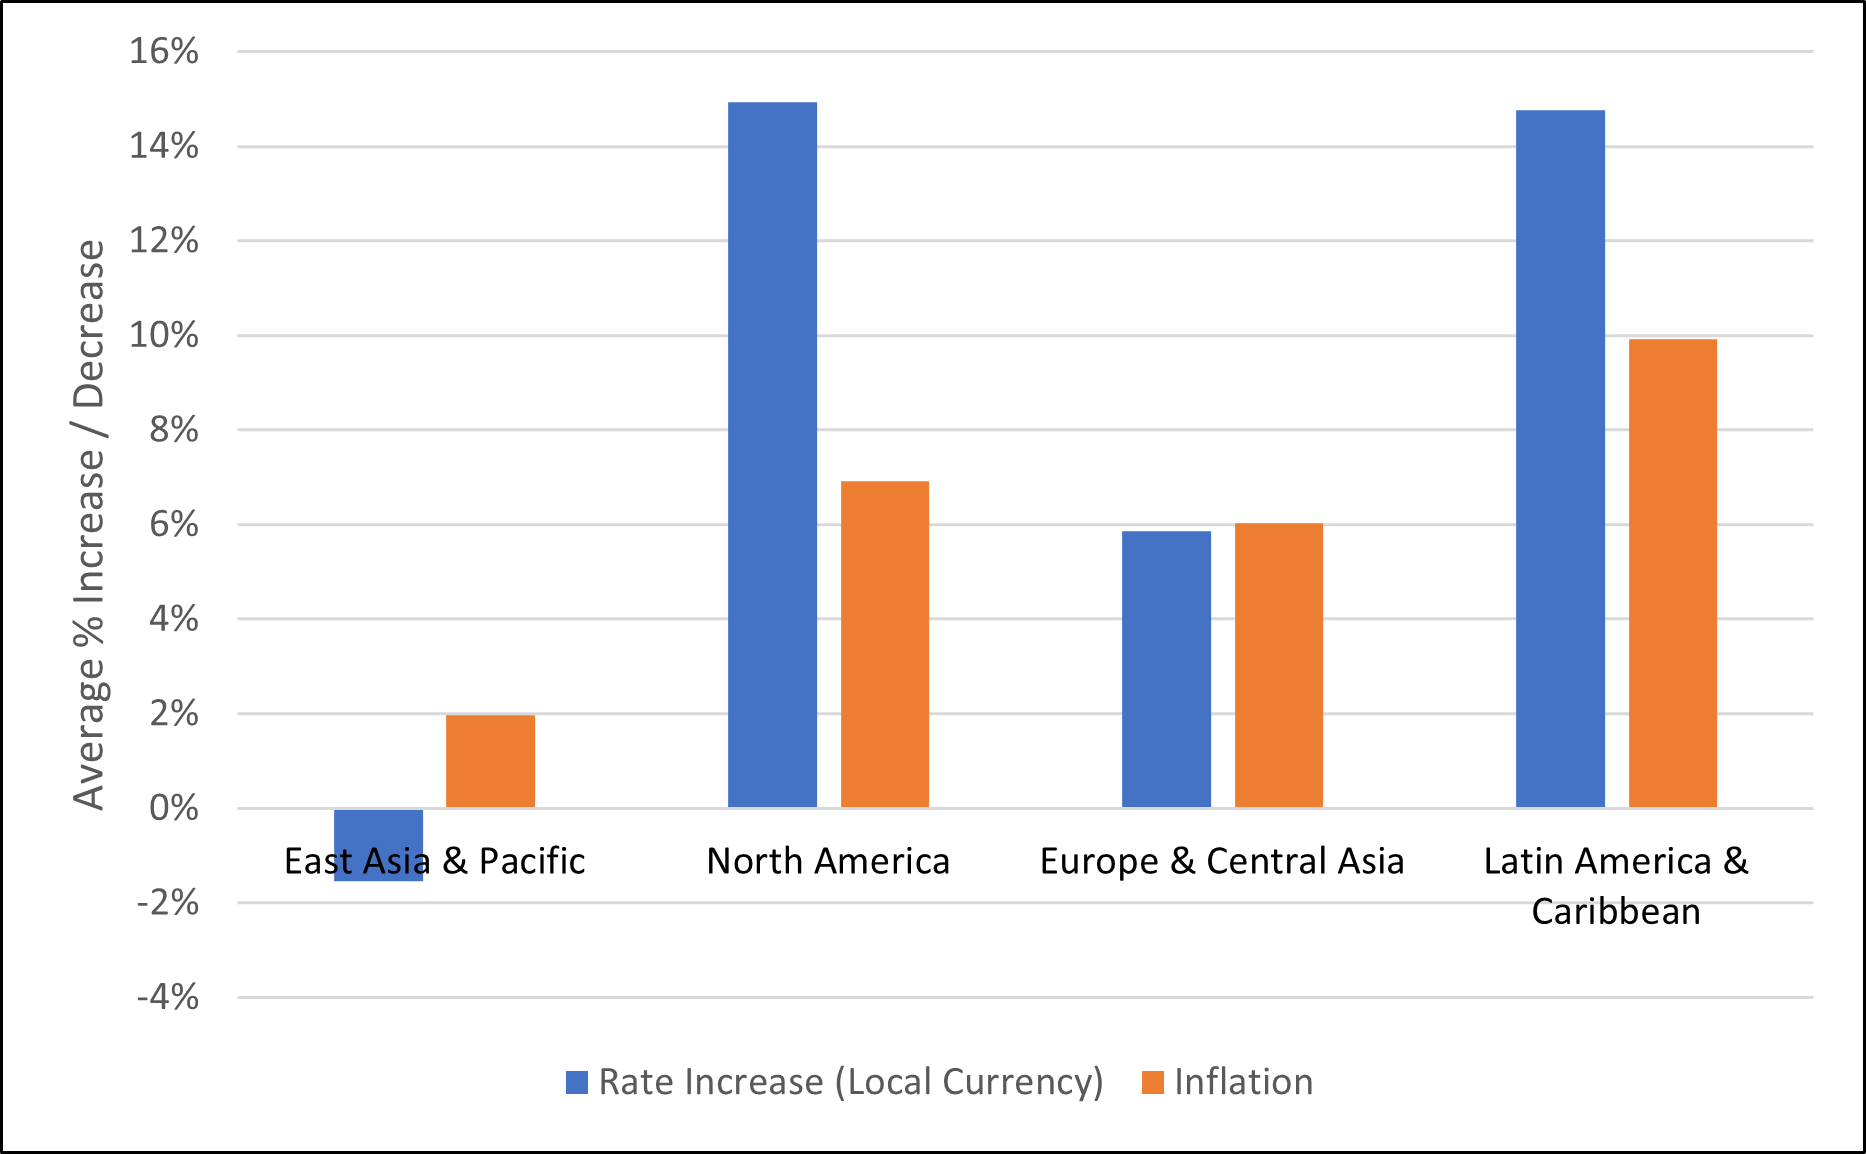
Figure 2. The average rate increase and inflation in local currency for 200 m³ of water and sanitation fees for cities in the database.
A shortcut to smart technologies
One of the ultimate goals of water management is total cost recovery, however, this needs to be considered from the perspective of an affordable water bill.
From the point of view of asset management of a water company, there is a lot of value going on. Every percentage of gain in efficiency could have a beneficial effect on the water production cost and on the water bill. New disruptive technologies like intelligent metering and smart water networks will lead to beneficial effects and will allow, for example, more correct sizing of the water assets or to lower the non-revenue water by detecting leakages.
Today, emerging technologies of smart metering based on IoT will accelerate the way to a smart water network. Current daily challenges such as pressure losses, fraud or reverse flow, to name a few, can be detected in real-time at the office, even before the customer is affected.
About International Statistics for Water Services
The Copenhagen edition 2022 of the ‘International Statistics for Water Services’ released at the IWA Water World Congress (11-15 September 2022) is an initiative from the IWA Specialist Group on Statistics and Economics (chaired by Ed Smeets, The Netherlands) and coordinated by the Working Group Statistics (chaired by Ann Bijnens, De Watergroep, Belgium).
About the IWA Specialist Group Statistics and Economics
The International Water Association (IWA) is a worldwide network of professionals, which aims to exchange scientific and professional knowledge, provided by academics and water managers, covering many aspects of the water cycle. Our Specialist Group on Statistics and Economics aims to provide a forum to debate how utilities are financed, how their various water tariff structures are, which indicators of performance they use, how they manage efficiency, etc. To achieve these goals, workshops and seminars are organized annually, and papers and books are written with the scope of sharing information and experiences that focus both on fundamental and on practical issues to be considered for the economic and responsible behavior of water utilities.


About the Statistics report, edition Copenhagen 2022
By means of international surveys, the Working Group Statistics provides professional information on water abstraction, consumption, charges and regulation at the country and city levels. So, we are glad to present this edition of our ‘International Statistics for Water Services’ with an update of data from 34 countries and more than 180 cities.
This Copenhagen 2022 report, in particular the charges and consumption sections, focuses on the water consumption of households. All the definitions of the several parameters have been discussed and fine-tuned by the members of the Working Group Statistics. For the quantitative information on population, production volumes etc., the years 2014, 2016, 2018 and 2020 are included. The information about tariffs is based on the consumption of 100 m³ and 200 m³ in 2015, 2017, 2019 and 2021. Concerning water charges, making time series is rather difficult, because of variation in the exchange rate in time, when recalculating the local valuta in US dollars.
The water prices do not necessarily reflect the full cost of water services, because some parts of the costs may be covered by sources other than the customer. In some cases, for example, there can be a political or social motivation to ensure that water is supplied at a socially acceptable price. Of course, there are many other factors affecting price levels, but these were out of the scope of this survey.
You are invited to take a closer look at the Copenhagen statistics and build your own graphs. I hope that the facts and figures will add a plus value to your job. Keep in mind that this survey is on a world scale and that you can easily down drill to your country, capital or a particular city.
Become part of the project
The most difficult challenge in making this report is to find the right contact person(s) for the countries. This single point of contact must be able to deliver, at the same time, data for the water sector and some country indicators. If your country is not listed in the Copenhagen report and if you want to volunteer to provide us with the valuable data of your country, please let us know and send us your contact details to IWA@dewatergroep.be
The making of…
Renato Parena, honorary chairman of the Specialist Group, for the Italian water services, launched the concept of the survey in the early 1990’s. Since that time we have been producing the biennial statistics of water services worldwide. To ‘keep up with the times’ we are proud to present the digital edition of the Statistics for the fourth time, which offers more possibilities than ever before.
Thanks to IWA, we have moved to a digital publishing platform. This will enable greater access to the statistics and permit us to update the data on a regularly base. Our main concern is the reliability of the data and quality control. Of course, it is evident that for the data quality we depend on the single points of contact who provided us with the data.
Thanks to all water professionals who helped obtain the data for this survey. Thanks to their effort we are able to give a valuable overview of important aspects of water services worldwide.
| Albania | N. Shani, Water Regulatory Authority |
| Austria | S. Krakow, OVGW |
| Belgium | P. Moniotte, Belgaqua and A. Bijnens, De Watergroep |
| Brazil | C. Rosito, ABES – Brazilian Association of Water and Sanitation Engineering |
| Bulgaria | I. Kastchiev, Energy and Water Regulatory Commission |
| Canada | D. Main, M. Amini and A. Kolesov, AECOM |
| Chile | R. Farias Flores and J. Páez Ilabaca, Super intendencia de Servicios Sanitarios – SISS |
| China | D. Wang, IWA-China Regional Office |
| Hong Kong SAR, China | Avery C N Lam, Water Supplies Department Hong Kong SAR Government |
| Chinese Taipei | G-S. Wang, Chinese Taiwan National Committee |
| Cyprus | P. Potamou, Limassol Water Board |
| Denmark | T. Sorensen, Danish Water and Wastewater Association |
| Finland | M. Rontu, Finnish Water Utilities Association |
| France | S. Pouradier-Duteil, Veolia Eau France |
| Germany | T. Herkner, Bundesverband der Energie- und Wasserwirtschaft e.V. |
| Greece | N. Safarikas, G. Safarikas and C. Safarikas, Helenic Union of Municipal Enterprises for Water Supply and Sewerage |
| Hungary | G. Patkó, MaViz |
| India | D. Hanumantha Chary, Indian Water Works Association |
| Japan | M. Shibuya, Japan Water Works Association |
| Macao SAR, China | N. Kuan, Macao Water |
| Malta | M. Camilleri, Regulator for Energy and Water Services |
| Netherlands | P.J.J.G. Geudens, Vewin |
| Norway | A. Haarr, Norwegian Water and Wastewater Ass. BA, Norsk Vann |
| Philipinnes | N.B. Javier, Philippine Water Works Association |
| Poland | P. Bartoszczuk, Warshau School of Economics |
| Portugal | F. Ruivo, ERSAR |
| Romania | E. Chiru, Romanian Water Association and D. Popa, Water company Brasov |
| Russia | A. Epstein, Russian Water and Wastewater Association |
| Singapore | W. Tan, PUB, Singapore’s National Water Agency |
| Slovakia | R. Wittmanová, Slovak National Committee IWA |
| South Korea | Z. Yun, Korean Society on Water Environment |
| Sri Lanka | W. Illangasinghe, National Water Supply and Drainage Board |
| Switzerland | M. Freiburghaus, Swiss Gass and Water Industry Association |
| United States of America | R. Craley, American Water Works Association and Raftelis Financial Consultants |
Interpreting the graphs correctly:
- The explanatory notes give more background information to interpret the data in the right way.
- All data are on country and city level, NOT on a company level.
- All financial data are converted to US$, the latest known exchange rate of December 2019.
- The exchange rates vary in time. Therefore it is not possible to compare charges in time.


Tips and tricks
- There is a wide range of statistics from abstraction to charges – Select the Statistic Type of data from the list.
- Depending on the statistic type, you can make a selection of a volume for 100 m³ or 200 m³ and for the years between 2014 and 2019 – Choose the Volume/Year.
- If you want to compare, please select all cities and/or all countries in the pop-up menu or mark the preferred selection – Select the Countries/Cities.
- Click the Generate button to see the data you’ve selected.
- You can Sort by ascending or descending on a specific parameter.
- By hovering on the bar, you can read the value.
- By hovering over the country/city, you can consult the available explanatory notes. Extensive notes can be consulted by clicking to view more details.
- Click the Share button to save the results or share them with others.